Prometheus + Grafana vs Netdata: RAM, disk, setup
Tested on Prometheus 3.15.1
Test result
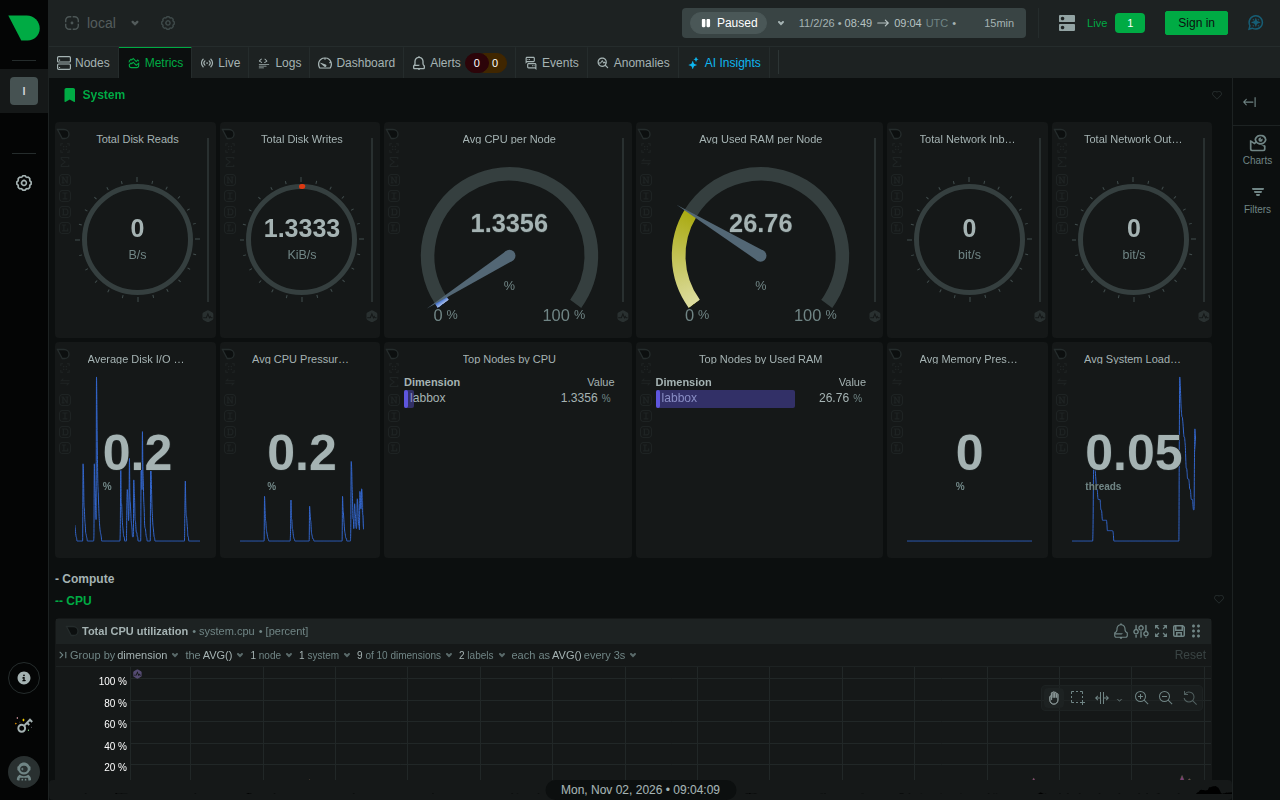
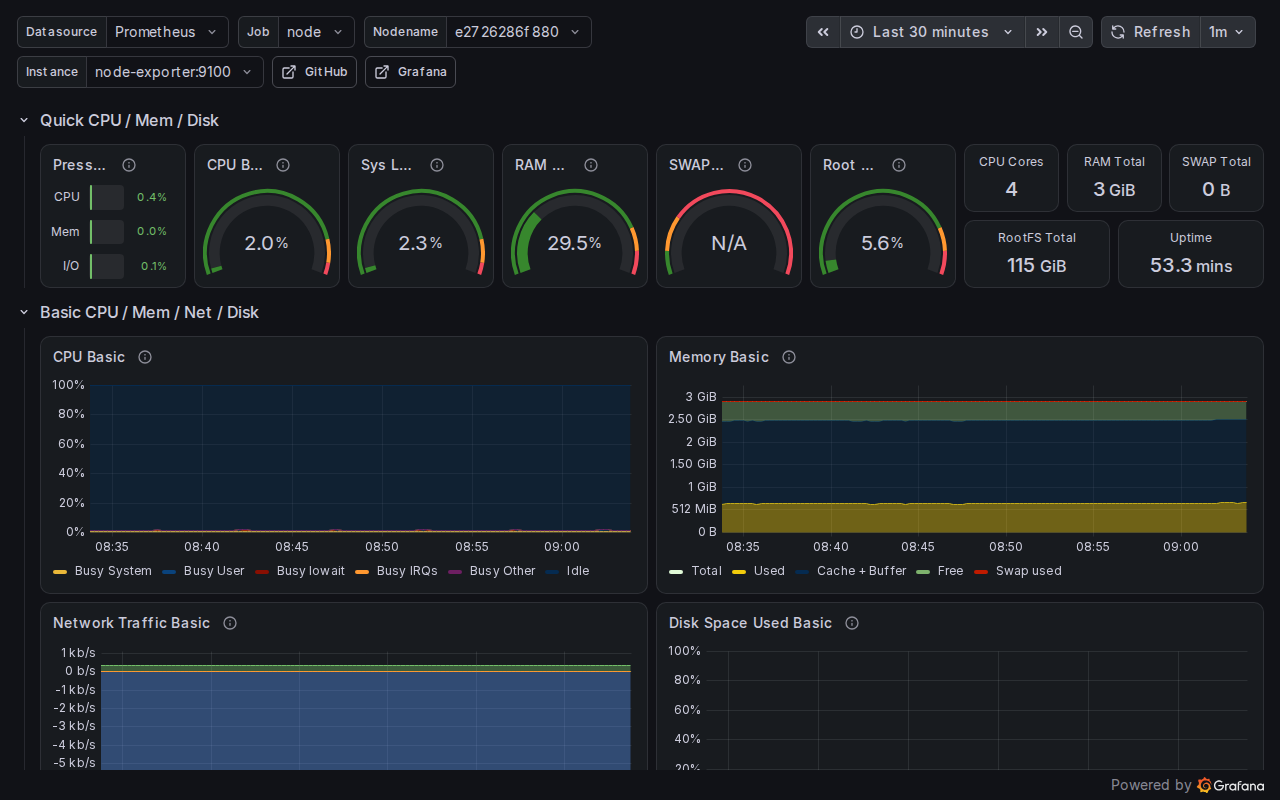
Netdata is the faster way to see a host: one command and a live dashboard in 7.3 s on this test box, against five actions and 34.9 s (scripted) for Prometheus + Grafana + node_exporter. RAM was close after 50 minutes: Netdata 331.6 MiB and the other stack 360.3 MiB, with Netdata collecting 4,103 dimensions against 568 Prometheus series, so the two are not a like-for-like cost.

The two stacks answer “how is this machine doing” in different ways. Netdata is one container that discovers what is on the host and draws it. Prometheus stores whatever you tell it to scrape, and Grafana draws whatever you tell it to query, so you assemble the dashboard yourself. This test measured what that difference costs in actions, RAM and disk, on one 4 vCPU, 3 GB VM watching itself.
Time to the first useful dashboard
“Useful” here means a live CPU value was returned, not that every panel was filled. Both stacks started from pulled images and empty volumes, one after the other, so only start-up and set-up are timed. Each was timed once. Netdata was started first and kept running while Prometheus + Grafana was timed, so the 34.9 s was measured with Netdata already using the VM’s CPUs.
| Stack | Step | What | Equivalent action | Seconds since the first step began |
|---|---|---|---|---|
| Netdata | 1 | start the stack | docker compose up -d | 0.7 |
| Netdata | Result | dashboard serves live CPU data (system.cpu chart returned values) | open http://host:19999 (no configuration) | 7.3 |
| Prometheus + Grafana | 1 | start the stack | docker compose up -d | 1.3 |
| Prometheus + Grafana | 2 | log in with the default admin account | UI: sign in as admin/admin (the UI then asks for a new password; skipped via API basic auth) | 21.5 |
| Prometheus + Grafana | 3 | add the Prometheus data source | UI: Connections > Data sources > Add > Prometheus > URL http://prometheus:9090 > Save | 21.5 |
| Prometheus + Grafana | 4 | download dashboard 1860 (Node Exporter Full) from grafana.com | UI: Dashboards > New > Import > 1860 | 21.5 |
| Prometheus + Grafana | 5 | import the dashboard | UI: select the data source > Import | 21.7 |
| Prometheus + Grafana | Result | a dashboard query (1-minute CPU rate) returns data | open the dashboard | 34.9 |
The numbered rows are the actions a person has to take; 'Result' is the first moment live data is available. A script ran them through the same APIs the UI calls, so the seconds are a floor for the manual path, not a human time. 'First useful' means a live CPU value was returned, not that every panel was filled.
Netdata needed the start command and opening the page. The script reached live CPU data 7.3 s after the start. In a browser the screenshot run also had to click “Skip and use the dashboard anonymously” on a welcome overlay, which is one more action that the timing does not include.
Prometheus + Grafana needed five actions: start the stack, sign in, add the Prometheus data source, find and import dashboard 1860 (Node Exporter Full) and confirm it. Scripted through Grafana’s API the actions were done 21.7 s after the start (most of it waiting for Grafana itself to answer) and a dashboard query returned data at 34.9 s, and it needed internet access to download the dashboard JSON from grafana.com. A person clicking through the same steps would take longer; this number is a floor.
RAM and disk after 50 minutes
Both stacks ran at the same time on the same VM, each watching it. They therefore each saw a little extra load from the other, and the numbers below should not be read as what each would cost alone.
| Component | On-disk size, MB: start -> first sample 9+ min later -> end (50 min run) | Growth after the first 9 min (least-squares) | Straight-line extrapolation to one day (not measured) | RAM at minutes 4-6 (MiB, median of 12) | RAM at end of run (MiB) |
|---|---|---|---|---|---|
| Prometheus + node_exporter (data: prom_data) | 0.0 -> 0.2 -> 0.9 | 18.8 KiB/min | 27.7 MB/day | 114.7 | 100.4 |
| Grafana (data: grafana_data) | 348.5 -> 567.4 -> 567.4 | 0.0 KiB/min | 0.0 MB/day | 258.0 | 259.9 |
| Netdata (config + lib + cache volumes) | 13.0 -> 13.6 -> 16.8 | 75.2 KiB/min | 110.9 MB/day | 330.1 | 331.6 |
| Prometheus + node_exporter + Grafana, together | 372.7 | 360.3 |
Both stacks monitored the same VM at the same time, so each saw a little extra load from the other. They do not collect the same number of series (see series-count.json). The first 9 minutes are left out of the rate because of one-time start-up writes (Grafana's volume grew by 218.9 MB in that window and then not at all). Extrapolations multiply the later per-minute rate; Prometheus compacts head blocks to disk on a schedule and Netdata has tiered retention, so a straight line is a rough guide only. VM 4 vCPU, 3 GB.
- Prometheus plus node_exporter used 100.4 MiB at the end and Grafana 259.9 MiB; together 360.3 MiB. Netdata used 331.6 MiB (330.1 MiB at minutes 4 to 6), so after 50 minutes the two stacks were within about 30 MiB of each other and the comparison needs the next section.
- Grafana’s volume went from 348.5 MB (taken right after the timing runs) to 567.4 MB at the 10-minute sample and did not change after that. The cause was not investigated. The lab’s earlier idle measurement of this stack also reported a data volume of about 567 MB, so it is a start-up cost, not growth with time.
- Over the last 40 minutes Prometheus’s data directory grew by 18.8 KiB/min and Netdata’s by 75.2 KiB/min. Multiplied to a day those are 27.7 MB and 110.9 MB, but that multiplication is an extrapolation from 40 minutes, and for Prometheus it is a poor one. The Prometheus docs say samples are held in a two-hour head block backed by a write-ahead log before they are compacted, and this run stopped at 50 minutes, so it saw the log and never a compaction. For Netdata the docs give per-second, per-minute and per-hour tiers with up to 1 GiB each by default, so its footprint is meant to be bounded, and this test did not run long enough to see the cap.
They are not collecting the same thing
| Stack | Metric | Value |
|---|---|---|
| Prometheus (node_exporter only, 15 s scrape) | Series held by Prometheus (count of all series) | 568 |
| Netdata (default collectors) | Charts / dimensions at the end of the run | 1734 / 4103 |
Prometheus here scrapes only node_exporter, at the end of the run. Netdata auto-detects and collects everything it finds on the host and in Docker; its documented default tier 0 resolution is per second. The two are not collecting the same set of metrics.
Prometheus scraped only node_exporter every 15 s and held 568 series. Netdata ran its default collectors and held 1,734 charts with 4,103 dimensions at the end (which collectors were active was not listed); its default tier 0 resolution is per second. So Netdata held about seven times as many dimensions as Prometheus had series, in a similar amount of RAM; adding more exporters to Prometheus would raise its RAM, and this test did not add any.
What the numbers suggest
On this test box, if the goal is “see CPU, memory, disks and containers on one host today”, Netdata gets there with less effort and, on this evidence, about the same RAM as the Prometheus stack (331.6 against 360.3 MiB). If the goal is to keep your own choice of metrics, write queries and alerts, and add other machines and applications later, the Prometheus and Grafana pair is the more general tool, and this test says nothing about how it scales. That last sentence is an opinion; the test measured one host.
Steps
Each stack uses its lab compose file unchanged. The test script pulls images, times the clean start of each, runs both for 50 minutes while sampling disk every 5 minutes, then samples RAM (12 samples, median).
services:
  netdata:
    image: netdata/netdata:v2.12.2
    restart: unless-stopped
    pid: host
    network_mode: host
    cap_add: [SYS_PTRACE, SYS_ADMIN]
    security_opt: [apparmor:unconfined]
    volumes:
      - netdataconfig:/etc/netdata
      - netdatalib:/var/lib/netdata
      - netdatacache:/var/cache/netdata
      - /:/host/root:ro,rslave
      - /etc/passwd:/host/etc/passwd:ro
      - /etc/group:/host/etc/group:ro
      - /etc/os-release:/host/etc/os-release:ro
      - /proc:/host/proc:ro
      - /sys:/host/sys:ro
      - /var/run/docker.sock:/var/run/docker.sock:ro
volumes:
  netdataconfig:
  netdatalib:
netdatacache:services:
prometheus:
image: prom/prometheus:v3.15.1
restart: unless-stopped
command:
- --config.file=/etc/prometheus/prometheus.yml
- --storage.tsdb.retention.time=15d
configs:
- source: prom
target: /etc/prometheus/prometheus.yml
volumes:
- prom_data:/prometheus
node-exporter:
image: prom/node-exporter:v1.10.2
restart: unless-stopped
pid: host
command: ["--path.rootfs=/host"]
volumes:
- /:/host:ro,rslave
grafana:
image: grafana/grafana:13.3.0
restart: unless-stopped
ports:
- "127.0.0.1:8080:3000"
volumes:
- grafana_data:/var/lib/grafana
configs:
prom:
content: |
global:
scrape_interval: 15s
scrape_configs:
- job_name: node
static_configs:
- targets: ["node-exporter:9100"]
volumes:
prom_data:
grafana_data:Show the full file
#!/usr/bin/env bash
# metrics: Prometheus 3.15.1 + Grafana 13.3.0 + node_exporter vs Netdata 2.12.2 on the same VM.
# Clean start to first useful dashboard (steps counted), then 50 min of data growth and RAM with both running.
set -uo pipefail
source "$(dirname "$0")/../_dlib.sh"
T=metrics; OUT="$ROOT/evidence/tests/$T"; RAW="$OUT/raw"
rm -rf "$OUT"; mkdir -p "$RAW"
DUR_MIN=${DUR_MIN:-50}
start_vm d-$T
D="$ROOT/lab/tests/$T"
gx 'mkdir -p ~/nd ~/prom'
vm scp-to "$ROOT/lab/stacks/netdata/compose.yml" nd/compose.yml >/dev/null
vm scp-to "$ROOT/lab/stacks/prometheus-grafana/compose.yml" prom/compose.yml >/dev/null
vm scp-to "$D/timeto.py" timeto.py >/dev/null; vm scp-to "$ROOT/lab/tests/_dsample.py" sample.py >/dev/null
dpull netdata/netdata:v2.12.2 prom/prometheus:v3.15.1 prom/node-exporter:v1.10.2 grafana/grafana:13.3.0
gx 'docker images --format "{{.Repository}}:{{.Tag}} {{.ID}}"' > "$RAW/images.txt"
# Clean-start timings, one stack at a time (images already pulled, so this is start-up only)
gx 'python3 ~/timeto.py netdata' > "$RAW/timeto-netdata.json" 2> "$RAW/timeto-netdata.err"
gx 'python3 ~/timeto.py prom' > "$RAW/timeto-prom.json" 2> "$RAW/timeto-prom.err"
T0=$(date +%s); echo "T0=$T0" > "$RAW/t0.txt"
VOLS="prom_prom_data prom_grafana_data nd_netdataconfig nd_netdatalib nd_netdatacache"
disk() { gx "for v in $VOLS; do echo \"$(date +%s) \$v \$(sudo du -sb /var/lib/docker/volumes/\$v/_data | cut -f1)\"; done" >> "$RAW/disk.tsv"; }
disk
sleep 240
gx 'python3 ~/sample.py prom-prometheus-1 prom-grafana-1 prom-node-exporter-1 nd-netdata-1' > "$RAW/ram-early.json"
while [ $(( $(date +%s) - T0 )) -lt $(( DUR_MIN * 60 )) ]; do sleep $(( 300 - ( $(date +%s) - T0 ) % 300 )); disk; done
gx 'python3 ~/sample.py prom-prometheus-1 prom-grafana-1 prom-node-exporter-1 nd-netdata-1' > "$RAW/ram-late.json"
{ echo "query: count all series"; gx 'docker exec prom-prometheus-1 wget -qO- "http://127.0.0.1:9090/api/v1/query?query=count({__name__=~\".%2B\"})"'
  echo; echo "netdata charts/dimensions:"; gx 'curl -s http://127.0.0.1:19999/api/v1/charts | python3 -c "import json,sys;d=json.load(sys.stdin)[\"charts\"];print(len(d),sum(len(c[\"dimensions\"]) for c in d.values()))"'
  gx 'docker ps --format "{{.Names}} {{.Status}}"; docker inspect -f "{{.Name}} restarts={{.RestartCount}}" $(docker ps -aq)'; } > "$RAW/end-state.txt" 2>&1
S="$ROOT/public/shots/$T"
shot 8080 "/d/rYdddlPWk/node-exporter-full?orgId=1&from=now-30m&to=now&kiosk" "$S/grafana-node-exporter.png" '[{"fill":"input[name=user]","value":"admin"},{"fill":"input[name=password]","value":"admin"},{"press":"Enter"},{"wait":4000},{"click":"text=Skip"},{"goto":"http://127.0.0.1:18391/d/rYdddlPWk/node-exporter-full?orgId=1&from=now-30m&to=now&kiosk"},{"wait":8000}]'
shot 19999 / "$S/netdata.png" '[{"wait":6000},{"click":"text=Skip and use the dashboard anonymously"},{"wait":8000}]'
collect_env "$OUT"
python3 "$D/summarize.py" "$RAW" "$OUT"Show the full file
#!/usr/bin/env python3
"""Runs in the VM. Times a clean start of each stack to its first useful dashboard and counts the steps.
Usage: timeto.py netdata|prom. Prints JSON with elapsed seconds (from the start of the first step) after every step."""
import base64, json, subprocess, sys, time, urllib.request, urllib.parse
which = sys.argv[1]
t0 = time.time(); steps = []
def mark(name, cmd_or_action):
    steps.append({"step": len(steps) + 1, "what": name, "action": cmd_or_action, "elapsed_s": round(time.time() - t0, 1)})
def http(url, data=None, headers=None, method=None):
    req = urllib.request.Request(url, data=data, headers=headers or {}, method=method)
    return urllib.request.urlopen(req, timeout=20).read()
def wait(fn, timeout=600):
    end = time.time() + timeout
    while time.time() < end:
        try:
            r = fn()
            if r: return r
        except Exception:
            pass
        time.sleep(1)
    raise SystemExit(json.dumps({"error": "timeout", "steps": steps}))
if which == "netdata":
    subprocess.run("cd ~/nd && docker compose -p nd up -d", shell=True, check=True, capture_output=True)
    mark("start the stack", "docker compose up -d")
    def cpu():
        d = json.loads(http("http://127.0.0.1:19999/api/v1/data?chart=system.cpu&after=-5&points=1&format=json"))
        return d if d.get("data") and d["data"][0] and any(v for v in d["data"][0][1:]) else None
    wait(cpu)
    mark("dashboard serves live CPU data (system.cpu chart returned values)", "open http://host:19999 (no configuration)")
else:
    subprocess.run("cd ~/prom && docker compose -p prom up -d", shell=True, check=True, capture_output=True)
    mark("start the stack", "docker compose up -d")
    auth = {"Authorization": "Basic " + base64.b64encode(b"admin:admin").decode()}
    wait(lambda: b"ok" in http("http://127.0.0.1:8080/api/health"))
    mark("Grafana answers /api/health", "wait")
    http("http://127.0.0.1:8080/api/org", headers=auth)
    mark("log in with the default admin account", "UI: sign in as admin/admin (the UI then asks for a new password; skipped via API basic auth)")
    ds = json.loads(http("http://127.0.0.1:8080/api/datasources", json.dumps({"name": "Prometheus", "type": "prometheus", "url": "http://prometheus:9090", "access": "proxy", "isDefault": True}).encode(), {**auth, "content-type": "application/json"}))
    mark("add the Prometheus data source", "UI: Connections > Data sources > Add > Prometheus > URL http://prometheus:9090 > Save")
    rev = json.loads(http("https://grafana.com/api/dashboards/1860/revisions"))["items"][0]["revision"] if False else None
    dash = json.loads(http("https://grafana.com/api/dashboards/1860/revisions/latest/download"))
    mark("download dashboard 1860 (Node Exporter Full) from grafana.com", "UI: Dashboards > New > Import > 1860")
    out = json.loads(http("http://127.0.0.1:8080/api/dashboards/import", json.dumps({"dashboard": dash, "overwrite": True, "inputs": [{"name": "DS_PROMETHEUS", "type": "datasource", "pluginId": "prometheus", "value": ds["datasource"]["uid"]}], "folderId": 0}).encode(), {**auth, "content-type": "application/json"}))
    mark("import the dashboard", "UI: select the data source > Import")
    q = urllib.parse.quote('100 - (avg(rate(node_cpu_seconds_total{mode="idle"}[1m])) * 100)')
    def cpu():
        d = json.loads(http(f"http://127.0.0.1:8080/api/datasources/proxy/uid/{ds['datasource']['uid']}/api/v1/query?query={q}", headers=auth))
        return d if d["data"]["result"] else None
    wait(cpu)
    mark("a dashboard query (1-minute CPU rate) returns data", "open the dashboard")
    steps.append({"dashboard_uid": out.get("uid"), "dashboard_title": dash.get("title"), "dashboard_revision_version": dash.get("version"), "dashboard_sha256": __import__("hashlib").sha256(json.dumps(dash, sort_keys=True).encode()).hexdigest()})
print(json.dumps(steps, indent=1))
What went wrong
An earlier version of this test had the guest drop its page cache every 3 s, which distorted the RAM readings; it was removed, the test rerun, and the old results discarded. Every number here comes from the rerun. The first 50-minute run was also lost once when a script deleted its output folder. Its Prometheus series count first came back empty because the query went through Grafana to a metric that Prometheus does not expose when it does not scrape itself; the script now asks Prometheus directly. Docker Hub rate limits also delayed image pulls in some runs and affected no measurement.
What this test did not cover
Sources and how this was made
- Prometheus docs: Storage
- Netdata docs: Disk requirements and retention
- Grafana dashboards: Node Exporter Full (1860)
How this page was made: the commands above were run by an AI agent on the test box on November 2, 2026, and the same agent drafted this text from the saved output. The site's owner reviewed the site before publication. Test method and editorial policy explain how results are checked, and what is not. Spotted an error? Tell us.