Uptime Kuma vs Gatus vs Beszel on 10 checks
Tested on Uptime Kuma 2.5.9
Test result
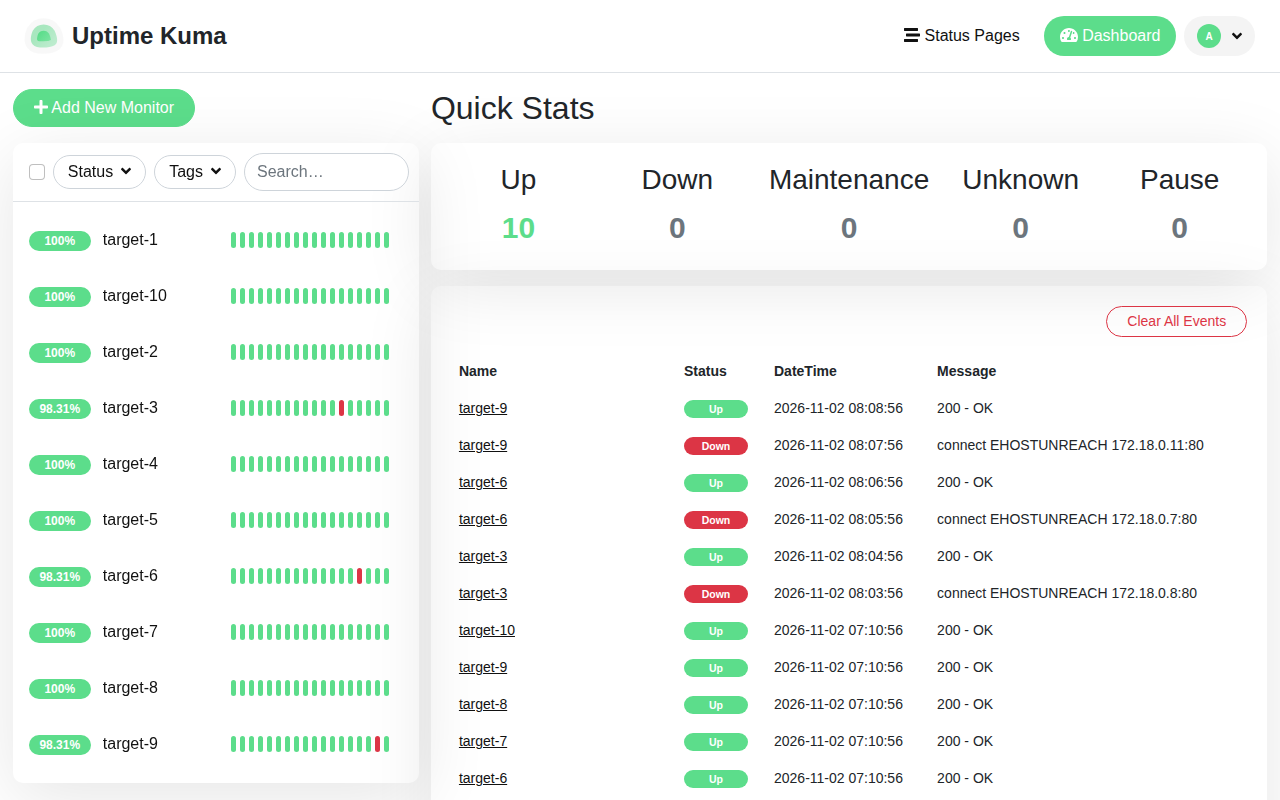
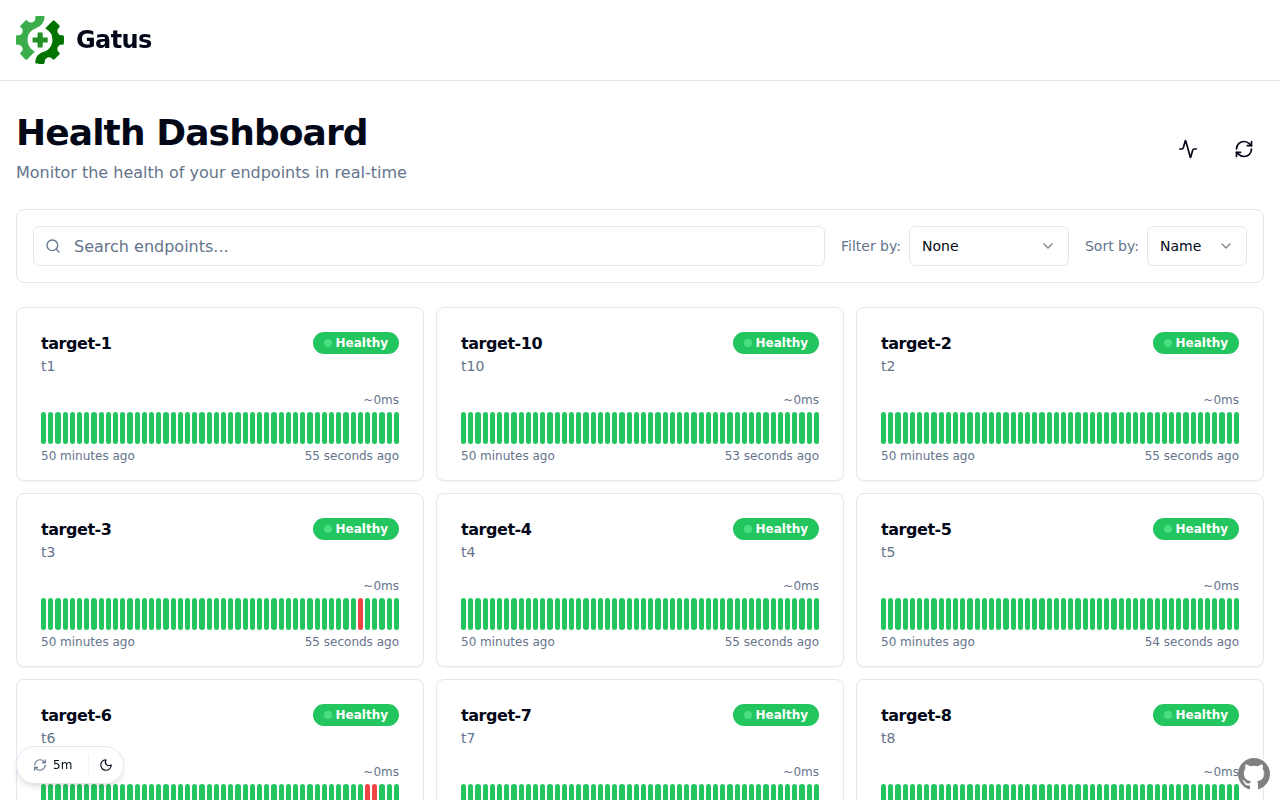
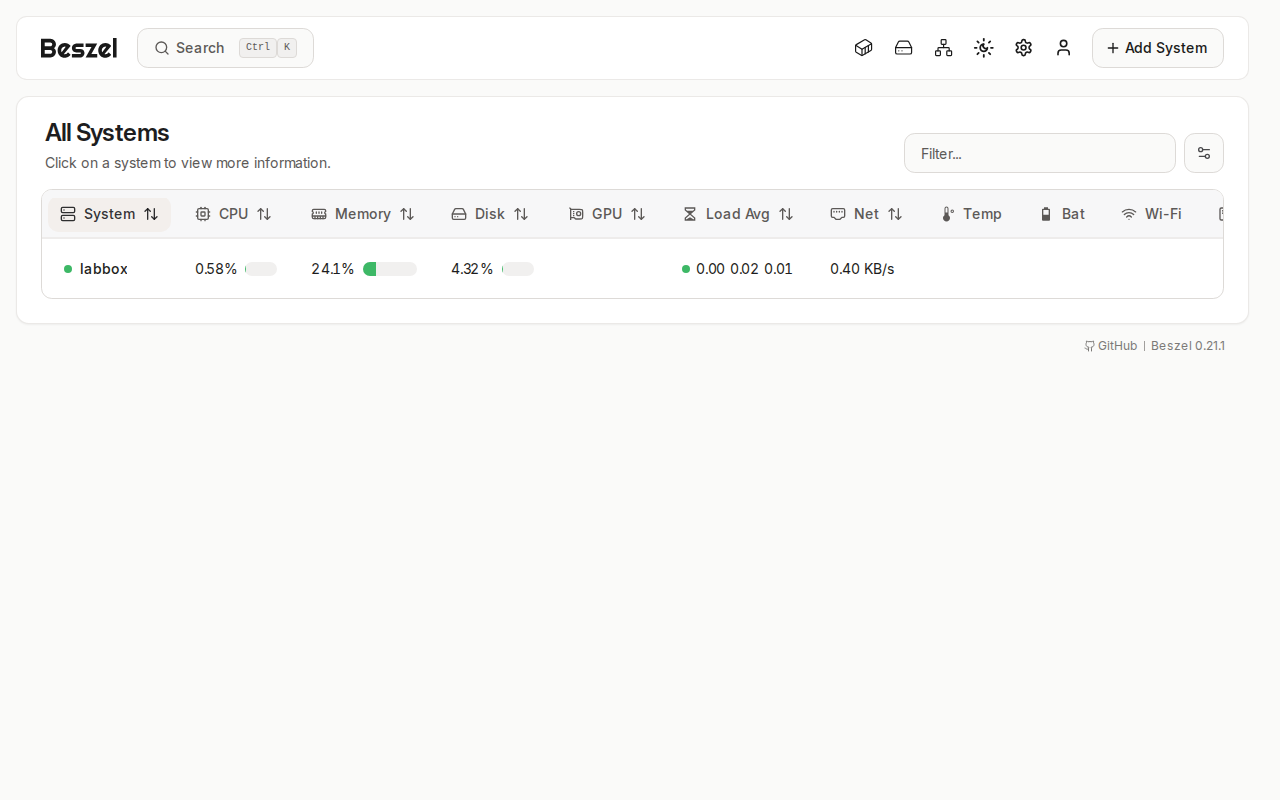
For plain HTTP checks, Gatus was the lightest here (8.6 MiB with 10 checks at 60 s) and Uptime Kuma the heaviest (204.0 MiB), but it adds and edits checks in a browser and shows a per-monitor history. Beszel 0.21.1 can also run HTTP checks from its agent, but it is mainly a host-metrics tool and used 19.7 MiB for hub plus agent. All three reported a killed target within 73 s.
Run Gatus if you want the smallest process and are happy to keep the checks in a YAML file. Run Uptime Kuma if you want to add and edit checks in a browser and see a history per monitor. Beszel answers a different question first (how is each host doing), and its HTTP checks are an extra.
Beszel is a host and container metrics hub, but its docs list network monitors (ICMP, TCP, HTTP and DNS probes run by the agent), and version 0.21.1 accepted ten HTTP monitors at a 60 s interval in this test. So it is included in the comparison, with the caveat that its agent and system metrics come with it.
Setup
The same ten targets for every tool: ten nginx:1.29-alpine containers, t1 to t10, on one Docker network. Each tool checked http://t1/ to http://t10/ every 60 s. Uptime Kuma was configured through its socket.io API with 0 retries and Gatus with a [STATUS] == 200 condition per endpoint. Beszel got ten HTTP network monitors with the agent as the prober. Gatus used SQLite storage so that it writes to disk like the other two; its default is in-memory storage, per the Gatus README. Uptime Kuma 2 asks for a database type on first start; the test set UPTIME_KUMA_DB_TYPE=sqlite (docs) to skip that screen.
services:
  gatus:
    image: twinproduction/gatus:v5.38.0
    restart: unless-stopped
    ports:
      - "127.0.0.1:8080:8080"
    configs:
      - source: gatus
        target: /config/config.yaml
configs:
  gatus:
    content: |
      endpoints:
        - name: self
          url: http://127.0.0.1:8080/health
          interval: 60s
          conditions:
            - "[STATUS] == 200"
The compose above is the single-endpoint idle stack from the lab. The test used a generated compose with the ten endpoints and the other two tools next to it; it is saved with the evidence and its generator is in the script below.
Memory and disk with 10 checks
| Tool | RAM, no checks (MiB, median of 12) | RAM, 10 checks, minutes 3-5 (MiB) | RAM, 10 checks, end of run (MiB) | Data volume size: start -> first sample 9+ min later -> end (KiB, 50 min run) | Growth rate after the first 9 min (least-squares) | Extrapolated to 30 days (MB, not measured) |
|---|---|---|---|---|---|---|
| Uptime Kuma 2.5.9 | 192.9 | 196.6 | 204.0 | 1370 -> 2766 -> 2842 KiB | 1.84 KiB/min | 81.4 MB |
| Gatus 5.38.0 (SQLite storage) | 6.5 | 8.0 | 8.6 | 857 -> 3283 -> 4220 KiB | 13.21 KiB/min | 584.4 MB |
| Beszel 0.21.1 (hub + agent) | 11.6 | 19.6 | 19.7 | 1175 -> 2012 -> 4668 KiB | 74.69 KiB/min | 3303.9 MB |
Gatus was recreated to load the ten checks, so its no-checks figure comes from a different process than the later two. Beszel rows include the agent container for the two check columns only; the no-checks column is the hub alone. The first jump is the initial database write when the checks are added. The 30-day figure multiplies the later per-minute rate by 43,200 minutes: an extrapolation from about 40 minutes of data, not a measurement. Retention settings change the shape (Gatus keeps at most 100 results per endpoint by default, so its file stops growing after about 100 minutes at a 60 s interval). VM 4 vCPU, 3 GB.
Gatus was recreated to load the ten checks, so its no-checks figure (6.5 MiB) comes from a different process than the 8.0 and 8.6 MiB with ten checks running; the rise of about 2 MiB is small but is not a clean before-and-after. Uptime Kuma went from 192.9 MiB with an account and no monitors to 204.0 MiB at the end, a rise of 11.1 MiB between a reading taken about 2 minutes after the account was created and one taken 56 minutes after start. This test cannot separate the effect of the ten monitors from the process simply running longer. Each figure is the median of 12 samples taken within about 96 s, from a single run. Beszel’s hub alone measured 11.6 MiB without a system; with the agent and ten monitors the pair used 19.7 MiB.
The idle figures in the lab’s stack table below were taken before configuration, and Uptime Kuma’s was taken on its database selection screen, which is why 108.8 MiB there is not comparable with the 193 to 204 MiB above.
| Stack | Version | RAM at idle | CPU at idle | Images on disk | Ready after |
|---|---|---|---|---|---|
| Gatus | 5.38.0 | 0.02% | 78.1 MB | 2.4 s | |
| Beszel hub | 0.21.1 | 0.00% | 47.5 MB | 1.6 s | |
| Uptime Kuma | 2.5.9 | 0.00% | 2531.2 MB | 4.6 s |
Disk growth
| Tool | +0 min | +10 min | +15 min | +20 min | +25 min | +30 min | +35 min | +40 min | +45 min | +50 min |
|---|---|---|---|---|---|---|---|---|---|---|
| Uptime Kuma 2.5.9 | 0 | 1396 | 1404 | 1416 | 1420 | 1428 | 1440 | 1452 | 1456 | 1472 |
| Gatus 5.38.0 (SQLite storage) | 0 | 2426 | 3303 | 3303 | 3303 | 3339 | 3339 | 3339 | 3339 | 3363 |
| Beszel 0.21.1 (hub + agent) | 0 | 837 | 1239 | 1642 | 2177 | 2716 | 3493 | 3493 | 3493 | 3493 |
`du -sb` of the Docker volume directory inside the VM.
The first sample after the checks started is not representative, because each tool writes its initial tables and settings then, so the rate in the summary uses only the samples after the first 9 minutes. Over those roughly 40 minutes Uptime Kuma grew by 1.84 KiB/min, Gatus by 13.21 KiB/min and Beszel by 74.69 KiB/min. The growth is also not steady: Gatus grew only from 3,303 to 3,363 KiB above its start between +15 and +50 min and Beszel stayed at 3,493 KiB from +35 min, so a straight line through the samples overstates what a longer run would show. Multiplied out to 30 days these become 81.4 MB, 584.4 MB and 3,303.9 MB. Those three numbers are an extrapolation from about 40 minutes of data, not something measured. Two caveats apply. Gatus stores at most 100 results per endpoint by default (README), so at a 60 s interval its database should stop growing after about 100 minutes, and its 584.4 MB is an overestimate. Beszel’s 3,303.9 MB is not reliable either, because its volume stopped growing for the last 15 minutes sampled (cause not investigated). Beszel’s figure also includes the host metrics the agent reports, not only the HTTP check results.
Does it notice a dead target, and how fast
For three targets (3, 6 and 9) the script ran docker kill on the container and polled each tool once a second: the Kuma metrics endpoint for monitor_status, the Gatus statuses API for a failed result, and the Beszel monitor record for loss1h rising above zero.
| Target killed | Uptime Kuma (0 retries) | Gatus | Beszel network monitor (loss1h above 0) |
|---|---|---|---|
| target-3 | 59.3 | 53.8 | 57.1 |
| target-6 | 62.6 | 10.0 | 72.5 |
| target-9 | 54.9 | 42.9 | 52.7 |
| Median (range) | 59.3 (range 54.9-62.6, n=3) | 42.9 (range 10.0-53.8, n=3) | 57.1 (range 52.7-72.5, n=3) |
Each target was killed at a different point in the 60 s cycle, so the numbers are mostly where in the interval the kill landed. Kuma: `monitor_status` on /metrics became 0. Gatus: newest result in the statuses API had success=false. Beszel: the monitor record's loss1h rose above 0. No alert channel was configured, so notification latency was not measured.
All three detected all three failures. The spread is mostly where in the 60 s cycle the kill landed: the raw log shows Gatus’s last good check for target-6 at 08:03:57 and its next at 08:04:57, so the 10.0 s result is a check that happened to run soon after the kill. Uptime Kuma’s 62.6 s is a little more than one 60 s interval. Beszel’s record was updated once a minute (at :08 past the minute in the raw log) and the loss figure only moved on an update after a failed probe, so its 72.5 s includes that update cadence. Each target was killed once per tool in a fixed order (3, 6, 9) and a single run, so n is 3. This test does not say that any tool is faster; with a 60 s interval, the expected wait is anywhere from 0 to about 60 s. A shorter interval is the lever, and the memory and disk figures above were measured only at 60 s.
Beszel decides on loss over time: its docs say a probe counts as loss when the request fails or the status is 400 or above, and the “Network Monitor Loss” alert fires when loss over the past hour exceeds the threshold (5% by default, with at least one notification channel and at least three probes needed). The loss figures here were 1.75 to 1.89 after one failed probe, below that default. So “detected” here means the loss figure moved, not that an alert would have fired. No notification channel was configured for any tool, so alert delivery was not tested.
Steps
The test script boots a throwaway VM, starts the three tools, measures a baseline, loads the ten checks, then samples for 50 minutes.
This file uses the public test value lab-only-not-a-secret. Replace every instance with your own secret before you run it.
Show the full file
#!/usr/bin/env bash
# monitors: Uptime Kuma 2.5.9, Gatus 5.38.0 and Beszel 0.21.1 checking the same 10 local nginx targets every 60 s.
# Measures RAM (baseline vs 10 checks), disk growth over 50 min, and how fast each reports a killed target.
set -uo pipefail
source "$(dirname "$0")/../_dlib.sh"
T=monitors; OUT="$ROOT/evidence/tests/$T"; RAW="$OUT/raw"
# DETECT_ONLY=1 re-runs only the detection part in a fresh VM (5 min of checks first) and keeps everything else in evidence/tests/monitors.
if [ -z "${DETECT_ONLY:-}" ]; then rm -rf "$OUT"; fi
mkdir -p "$RAW"
DUR_MIN=${DUR_MIN:-50}
start_vm d-$T
D="$ROOT/lab/tests/$T"
gx 'mkdir -p ~/m'
for f in gen-compose.py kuma-setup.js beszel-setup.py sample.py detect.py; do vm scp-to "$D/$f" "m/$f" >/dev/null; done
dpull louislam/uptime-kuma:2.5.9 twinproduction/gatus:v5.38.0 henrygd/beszel:0.21.1 henrygd/beszel-agent:0.21.1 nginx:1.29-alpine
gx 'cd ~/m; python3 gen-compose.py 0 && docker compose up -d 2>&1 | tail -1'
sleep 20
# Baseline: apps configured but with no checks (Kuma: admin, 0 monitors; Beszel hub: one user, no system; Gatus: one self-check)
gx 'cd ~/m; docker cp kuma-setup.js mon-uptime-kuma-1:/app/kuma-setup.js; docker exec mon-uptime-kuma-1 node /app/kuma-setup.js 0; python3 beszel-setup.py hub' > "$RAW/setup-baseline${DETECT_ONLY:+-detect}.txt" 2>&1
if [ -z "${DETECT_ONLY:-}" ]; then sleep 120
gx 'cd ~/m; python3 sample.py mon-uptime-kuma-1 mon-gatus-1 mon-beszel-1' > "$RAW/ram-baseline.json"; fi
# Phase B: 10 checks at 60 s on every tool
gx 'cd ~/m; python3 gen-compose.py 10 && docker compose up -d --force-recreate gatus 2>&1 | tail -2; docker compose up -d 2>&1 | tail -1; cp compose.yml ~/m/compose.used.yml
 docker exec mon-uptime-kuma-1 node /app/kuma-setup.js 10
 KEY=$(python3 - <<P
import json,urllib.request as u
H="http://127.0.0.1:8083"
r=lambda p,b=None,t=None: json.load(u.urlopen(u.Request(H+p,data=json.dumps(b).encode() if b else None,headers={"content-type":"application/json",**({"Authorization":t} if t else {})})))
t=r("/api/collections/_superusers/auth-with-password",{"identity":"admin@lab.internal","password":"lab-only-not-a-secret"})["token"]
print(r("/api/beszel/getkey",t=t)["key"])
P
)
 docker run -d --name beszel-agent --network mon_default --restart unless-stopped -e KEY="$KEY" -e PORT=45876 -v /var/run/docker.sock:/var/run/docker.sock:ro henrygd/beszel-agent:0.21.1 >/dev/null
 python3 beszel-setup.py full' > "$RAW/setup-checks${DETECT_ONLY:+-detect}.txt" 2>&1
[ -z "${DETECT_ONLY:-}" ] && gx 'cat ~/m/compose.used.yml' > "$OUT/compose.used.yml"
sleep 5; N=$(gx 'curl -s localhost:8082/api/v1/endpoints/statuses | python3 -c "import json,sys;print(len(json.load(sys.stdin)))"'); echo "gatus endpoints loaded: $N" > "$RAW/gatus-endpoints${DETECT_ONLY:+-detect}.txt"; [ "$N" = 10 ] || { echo "gatus did not load 10 endpoints" >&2; exit 1; }
if [ -n "${DETECT_ONLY:-}" ]; then
  sleep 330
  for n in 3 6 9; do
    gx "cd ~/m; python3 detect.py $n" > "$RAW/detect-$n.json" 2> "$RAW/detect-$n.err"
    sleep $(( n * 7 + 23 ))
  done
  mkdir -p "$RAW/detect-env"; collect_env "$RAW/detect-env"
  python3 "$D/summarize.py" "$RAW" "$OUT"; exit 0
fi
T0=$(date +%s); echo "T0=$T0" > "$RAW/t0.txt"
disk() { gx "for v in kuma_data gatus_data beszel_data; do echo \"$(date +%s) \$v \$(sudo du -sb /var/lib/docker/volumes/mon_\$v/_data | cut -f1)\"; done" >> "$RAW/disk.tsv"; }
disk
sleep 180
gx 'cd ~/m; python3 sample.py mon-uptime-kuma-1 mon-gatus-1 mon-beszel-1 beszel-agent' > "$RAW/ram-early.json"
shot_all=0
while [ $(( $(date +%s) - T0 )) -lt $(( DUR_MIN * 60 )) ]; do
  sleep $(( 300 - ( $(date +%s) - T0 ) % 300 )); disk
done
gx 'cd ~/m; python3 sample.py mon-uptime-kuma-1 mon-gatus-1 mon-beszel-1 beszel-agent' > "$RAW/ram-late.json"
gx 'docker ps --format "{{.Names}} {{.Status}}"; docker inspect -f "{{.Name}} restarts={{.RestartCount}}" $(docker ps -aq)' > "$RAW/containers-end.txt"
# Detection: kill target 3, 6, 9 at different phases of the 60 s cycle
for n in 3 6 9; do
  gx "cd ~/m; python3 detect.py $n" > "$RAW/detect-$n.json" 2> "$RAW/detect-$n.err"
  sleep $(( n * 7 + 23 ))
done
# Screenshots
S="$ROOT/public/shots/$T"
shot 8081 / "$S/uptime-kuma.png" '[{"fill":"input[name=username],#floatingInput","value":"admin"},{"fill":"input[type=password]","value":"lab-only-not-a-secret"},{"press":"Enter"},{"wait":6000}]'
shot 8082 / "$S/gatus.png"
shot 8083 / "$S/beszel.png" '[{"fill":"input[placeholder=\"name@example.com\"]","value":"lab@lab.internal"},{"fill":"input[type=password]","value":"lab-only-not-a-secret"},{"press":"Enter"},{"wait":6000}]'
gx 'docker exec mon-gatus-1 /gatus --help 2>&1 | head -2; docker images --format "{{.Repository}}:{{.Tag}}" | grep -E "kuma|gatus|beszel|nginx"' > "$RAW/versions.txt" 2>&1
collect_env "$OUT"
python3 "$D/summarize.py" "$RAW" "$OUT"
How the checks are loaded:
This file uses the public test value lab-only-not-a-secret. Replace every instance with your own secret before you run it.
Show the full file
// Runs inside the uptime-kuma container (socket.io-client is bundled in the image).
// Creates the admin account and 10 HTTP monitors at a 60 s interval.
const { io } = require("socket.io-client");
const s = io("http://127.0.0.1:3001");
const call = (ev, ...a) => new Promise((res) => s.emit(ev, ...a, res));
s.on("connect", async () => {
  console.log("setup", JSON.stringify(await call("setup", "admin", "lab-only-not-a-secret")));
  const l = await call("login", { username: "admin", password: "lab-only-not-a-secret", token: "" });
  console.log("login", l.ok);
  for (let i = 1; i <= (parseInt(process.argv[2] || "10")); i++) {
    const r = await call("add", {
      type: "http", name: `target-${i}`, url: `http://t${i}/`, method: "GET", interval: 60, retryInterval: 60,
      resendInterval: 0, maxretries: 0, timeout: 48, notificationIDList: {}, ignoreTls: false, upsideDown: false,
      maxredirects: 10, accepted_statuscodes: ["200-299"], dns_resolve_type: "A", dns_resolve_server: "1.1.1.1",
      expiryNotification: false, conditions: [], packetSize: 56, kafkaProducerBrokers: [], kafkaProducerSaslOptions: { mechanism: "None" },
      rabbitmqNodes: [], authMethod: null, httpBodyEncoding: "json", active: true,
    });
    console.log(i, JSON.stringify(r));
  }
  process.exit(0);
});
setTimeout(() => { console.log("timeout"); process.exit(1); }, 60000);This file uses the public test value lab-only-not-a-secret. Replace every instance with your own secret before you run it.
Show the full file
#!/usr/bin/env python3
"""Runs in the VM. Creates a Beszel user, registers the agent as a system and adds 10 HTTP network monitors (60 s)."""
import json, subprocess, time, urllib.parse, urllib.request
H = "http://127.0.0.1:8083"
def api(path, body=None, tok=None, method=None):
    req = urllib.request.Request(H + path, data=json.dumps(body).encode() if body is not None else None, method=method or ("POST" if body is not None else "GET"),
                                 headers={"content-type": "application/json", **({"Authorization": tok} if tok else {})})
    try:
        return json.load(urllib.request.urlopen(req, timeout=20))
    except urllib.error.HTTPError as e:
        return {"error": e.code, "body": e.read().decode()[:400]}
subprocess.run(["docker", "exec", "mon-beszel-1", "/beszel", "superuser", "upsert", "admin@lab.internal", "lab-only-not-a-secret"], check=True, capture_output=True)
tok = api("/api/collections/_superusers/auth-with-password", {"identity": "admin@lab.internal", "password": "lab-only-not-a-secret"})["token"]
u = api("/api/collections/users/records", {"email": "lab@lab.internal", "password": "lab-only-not-a-secret", "passwordConfirm": "lab-only-not-a-secret", "role": "admin", "verified": True}, tok)
if "id" not in u:  # already created in the baseline phase
    u = api("/api/collections/users/records?filter=" + urllib.parse.quote('email="lab@lab.internal"'), tok=tok)["items"][0]
print("user", u.get("id") or u)
import sys
if len(sys.argv) > 1 and sys.argv[1] == "hub":
    sys.exit(0)  # baseline: hub with a user, no system, no monitors
sysr = api("/api/collections/systems/records", {"name": "labbox", "host": "beszel-agent", "port": "45876", "users": [u["id"]]}, tok)
print("system", sysr.get("id") or sysr)
for i in range(1, 11):
    r = api("/api/collections/network_monitors/records", {"system": sysr["id"], "target": f"http://t{i}", "protocol": "http", "port": 80, "interval": 60, "enabled": True}, tok)
    print("monitor", i, r.get("id") or r)
time.sleep(5)
print(json.dumps(api("/api/collections/systems/records/" + sysr["id"], tok=tok))[:300])Show the full file
#!/usr/bin/env python3
"""Generates compose.yml: 10 nginx targets plus Uptime Kuma, Gatus and the Beszel hub (versions as pinned in lab/stacks).
Usage: gen-compose.py [gatus_endpoints]. 0 (default) = the single self-check of lab/stacks/gatus (baseline); 10 = the ten targets."""
import sys
N = int(sys.argv[1]) if len(sys.argv) > 1 else 0
targets = "\n".join(f"  t{i}:\n    image: nginx:1.29-alpine\n    restart: unless-stopped" for i in range(1, 11))
gat = "        - name: self\n          url: http://127.0.0.1:8080/health\n          interval: 60s\n          conditions:\n            - \"[STATUS] == 200\"" if N == 0 else "\n".join(f"        - name: target-{i}\n          url: http://t{i}/\n          interval: 60s\n          conditions:\n            - \"[STATUS] == 200\"" for i in range(1, 11))
open("compose.yml", "w").write(f"""name: mon
services:
{targets}
  uptime-kuma:
    image: louislam/uptime-kuma:2.5.9
    restart: unless-stopped
    ports: ["127.0.0.1:8081:3001"]
    environment: {{UPTIME_KUMA_DB_TYPE: sqlite}}
    volumes: [kuma_data:/app/data]
  gatus:
    image: twinproduction/gatus:v5.38.0
    restart: unless-stopped
    ports: ["127.0.0.1:8082:8080"]
    volumes: [gatus_data:/data]
    configs:
      - source: gatus
        target: /config/config.yaml
  beszel:
    image: henrygd/beszel:0.21.1
    restart: unless-stopped
    ports: ["127.0.0.1:8083:8090"]
    volumes: [beszel_data:/beszel_data]
volumes:
  kuma_data:
  gatus_data:
  beszel_data:
configs:
  gatus:
    content: |
      storage:
        type: sqlite
        path: /data/gatus.db
      endpoints:
{gat}
""")This file uses the public test value lab-only-not-a-secret. Replace every instance with your own secret before you run it.
Show the full file
#!/usr/bin/env python3
"""Runs in the VM: kills target container t<N>, then polls the three tools once a second until each reports it down (max 200 s).
Usage: detect.py <N>. Prints JSON with seconds from the kill to the first poll that shows the target as failed."""
import base64, json, subprocess, sys, time, urllib.request
n = sys.argv[1]
def get(url, headers=None):
    return urllib.request.urlopen(urllib.request.Request(url, headers=headers or {}), timeout=10).read().decode()
def post(url, body):
    return json.load(urllib.request.urlopen(urllib.request.Request(url, data=json.dumps(body).encode(), headers={"content-type": "application/json"}), timeout=10))
kauth = {"Authorization": "Basic " + base64.b64encode(b"admin:lab-only-not-a-secret").decode()}
tok = post("http://127.0.0.1:8083/api/collections/_superusers/auth-with-password", {"identity": "admin@lab.internal", "password": "lab-only-not-a-secret"})["token"]
def kuma():
    for l in get("http://127.0.0.1:8081/metrics", kauth).splitlines():
        if l.startswith("monitor_status") and f'monitor_name="target-{n}"' in l:
            return l.rsplit(" ", 1)[1]
def gatus():
    for e in json.loads(get("http://127.0.0.1:8082/api/v1/endpoints/statuses")):
        if e["name"] == f"target-{n}":
            r = e["results"][-1]
            return "ok" if r["success"] else "FAIL", r["timestamp"]
def beszel():
    q = urllib.parse.quote(f'target="http://t{n}"')
    it = json.loads(get(f"http://127.0.0.1:8083/api/collections/network_monitors/records?filter={q}", {"Authorization": tok}))["items"][0]
    return {"loss1h": it["loss1h"], "res": it["res"], "updated": it["updated"]}
import urllib.parse
def gatus_dbg():
    g = gatus()
    if g is None:
        print("gatus: target-%s not found in statuses: %s" % (n, get("http://127.0.0.1:8082/api/v1/endpoints/statuses")[:400]), file=sys.stderr); g = ("MISSING", "")
    return g
before = {"kuma": kuma(), "gatus": gatus_dbg(), "beszel": beszel()}
t0 = time.time()
subprocess.run(["docker", "kill", f"mon-t{n}-1"], capture_output=True, check=True)
det = {}; log = []
while time.time() - t0 < 200 and len(det) < 3:
    t = round(time.time() - t0, 1)
    k, g, b = kuma(), gatus_dbg(), beszel()
    log.append({"t": t, "kuma": k, "gatus": g, "beszel": b})
    if "kuma" not in det and k == "0": det["kuma"] = t
    if "gatus" not in det and g[0] == "FAIL": det["gatus"] = t
    if "beszel" not in det and b["loss1h"] > 0: det["beszel"] = t
    time.sleep(1)
subprocess.run(["docker", "start", f"mon-t{n}-1"], capture_output=True)
# keep only the lines around changes to stay small
compact = [x for i, x in enumerate(log) if i == 0 or (x["kuma"], x["gatus"][0], x["beszel"]["loss1h"]) != (log[i-1]["kuma"], log[i-1]["gatus"][0], log[i-1]["beszel"]["loss1h"])]
print(json.dumps({"target": n, "before": before, "detected_seconds_after_kill": det, "changes": compact}, indent=1))
What went wrong
An earlier complete run was discarded. docker compose up -d did not recreate the Gatus container after its inline config changed, so Gatus kept checking only its single baseline endpoint for the whole run; the dashboard screenshot at the end showed one card instead of ten. The script now uses --force-recreate for Gatus and aborts if it does not report ten endpoints. The detection script also failed in that run for the same reason (it could not find target-3 in Gatus). That run also had the guest drop its page cache every 3 s, which inflated RAM readings; the test was rerun without it, and every number on this page comes from that rerun (raw files dated 2026-11-02). The lab stack table above comes from separate idle measurements taken on 2026-11-01. Docker Hub also answered HTTP 429 (rate limit) to some image pulls; the script retries pulls and no number was affected.
What this test did not cover
Sources and how this was made
- Beszel docs: Network monitors
- Beszel docs: What is Beszel?
- Gatus README: storage and endpoint settings
- Uptime Kuma wiki: Environment variables
How this page was made: the commands above were run by an AI agent on the test box on November 1, 2026, and the same agent drafted this text from the saved output. The site's owner reviewed the site before publication. Test method and editorial policy explain how results are checked, and what is not. Spotted an error? Tell us.